Download
3 versions : Classic , Astrophoto and Sodium
link for fast preview
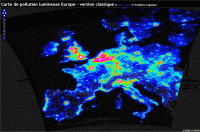
classic
![]()
Google Earth files (need google earth)
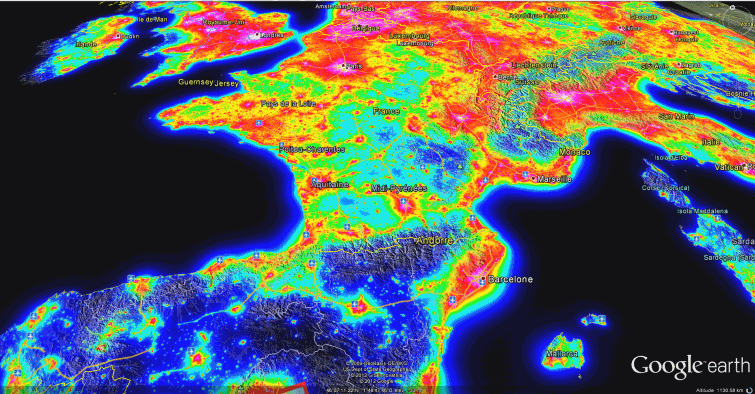
europe-classique.zip: <= Classic view
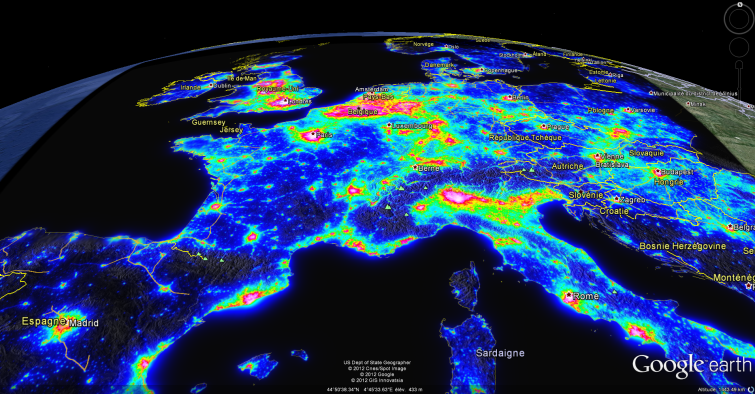
White : 0–15 visible stars (without planets) according to the conditions. Very high level of light pollution and all around. Typical of big urban centre and big regional and national cities.
Magenta : 25–80 visible stars. Principles constellations began to be recognizable.
Red : 80–150 stars : constellations and others stars appears. In a telescope, Some Messier object began to be observable.
Orange : 150–250 stars in good conditions. The light pollution is present all around but some darks areas appears. Typicaly the middle suburbs.
Yellow : 250–500 stars. Strong light pollution but the Milky Way can appear in good conditions. Some Messiers among the most bright can be visible with the necked eye.
Green : 500–1000 stars : far peacefull suburbs, Milky Way many times visible but very sensitive to the atmospheric conditions. Typicaly, the glare of light pollution take a large place in the sky and reach at 40–50° of elevation.
Cyan : 1000–1500 stars. The Milky Way is visible most of the time in fonction of climatic conditions but without contrast.
Blue : 1500–2000 stars. Good sky. The Milky Way is easily visible, we began to have the sensation of a good sky, but, some source of light pollution damage the sky and in a second time the sky by reflexion at the vertical of the observer.
Night blue : 2000–3000 stars. Very good sky. The Milky Way is present and powerfull. The light glares are far away and scaterred, they don’t affect the sky quality.
Black : more than 3000 stars. No light pollution problems revealable on the sky quality
___________
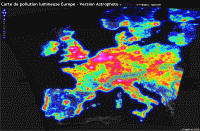
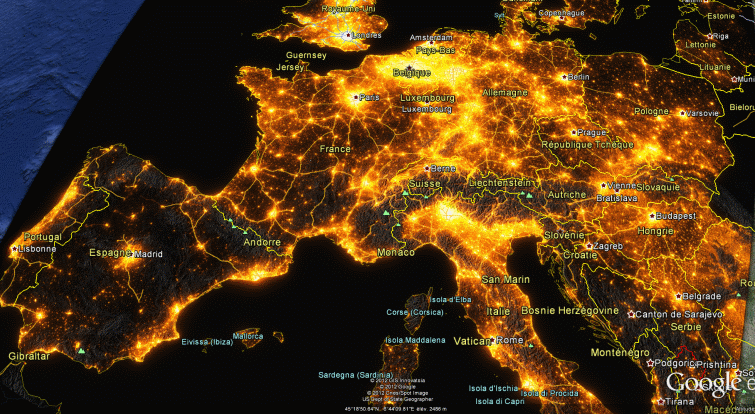
astrophoto.kml <= Astrophoto enanced
_______________
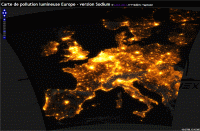
sodium.kml <= Sodium
Introduction
Après quels mois de réflexion préparatoire et des semaines de réalisations, Avex est extrêmement fière de vous présenter les nouvelles cartes de pollution lumineuse, à l’échelle européenne.
Le besoin d’une carte unifié à l’échelle Européene se faisait de plus en plus sentir – d’abord cela permet d’englober des pays qui n’ont jusqu’alors jamais été faits : Italie, Autriche, Pologne, Tchéquie, Slovénie, Hongrie, pays de l’Ex-Yougoslavie, Albanie, Lituanie, Danemark, Estonie, Irlande et des couverture partielle de la Norvège, Suède, Finlande, Roumanie, Bulgarie, et exclusion totale de la Grèce du fait d’une regretable absence de données pour ce pays – ensuite pour permettre de comparer à l’échelle européenne
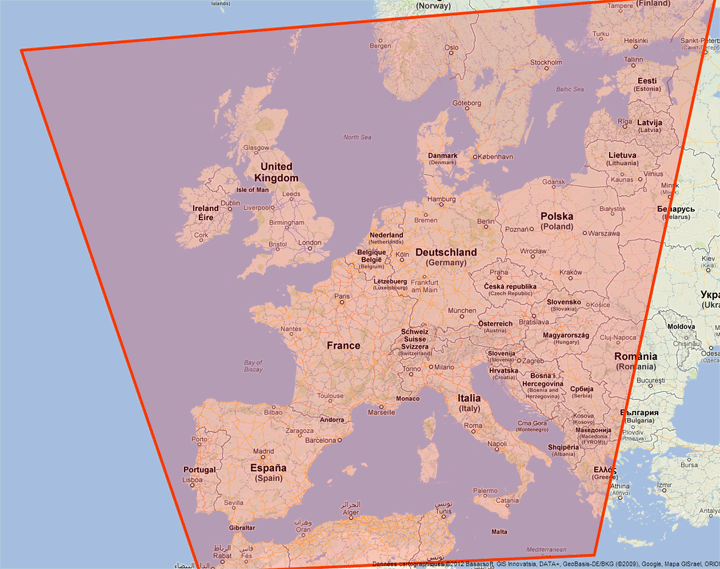
- Couverture approximative de la carte de pollution lumineuse
Ce qui change par rapport aux cartes nationales : (to translate)
1. Pour la première fois , les cartes Avex sont géoréférencées, c’est a dire parfaitement exacte spatialement, importable et exportable depuis n’importe quel logiciel SIG
2. les échelles des pays sont unifiées sur la même base, toute fois des facteurs multiplificatif ou diviseur ou été appliqué sur certains pays pour mieux rendre compte des spécificités locales
3. la pondération altimétrique a été un peu amoindrie, toujours pour mieux rendre compte des observations in situ
4. les cartes, extrêmement volumineuse dans leur version initiale, ne sont disponibles que depuis google earth : je ne distribue plus les PDF ou les TIF qu’au cas par cas sur demande (plus d’un Go par carte)
5. les routes interurbaines ne sont pratiquement plus prises en compte, sauf certaines grandes et larges autoroutes
Ce qui ne change pas (to translate)
l’échelle des couleurs est la même, les indications sont toujours valides
La carte n’est valable que pour un cône zénithal de 50 ° (c’est à dire par rapport à la verticale d’ un lieu donné), et ne rend pas compte des effets de la pollution lumineuse à l’horizon. Pour considérer les valeurs indiquées sur la carte, il est entendu que l’observateur ne doit pas se trouver directement exposé lui-même à une source de lumière directe, et qu’ il se trouve depuis vingt minutes -au moins- à l’abri de toute source de lumière directe.
L’exactitude des données n’est pas garantie : les valeurs sont indicatives et obtenues par le seul calcul, et non basées sur la réalité. Des phénomènes très localisés, comme l’éclairage de monuments ou d’édifices publics, ou au contraire l’extinction des luminaires passés une certaine heure, peuvent fausser localement les données. Ces cartes rendent compte de la pollution lumineuse pour 23 h, l’hiver, avec un taux moyen de 85° d’humidité.
Les zones aquatiques ne sont pas à prendre en considération : la propagation des halos lumineux a été volontairement fortement atténuée au-dessus des mers, et ce, dans un souci de clarté. Ces cartes rendent compte des zones urbaines, ZA, ZI, zones pavillonnaires, ports, aéroports, certains aérodromes, grosses autoroutes et certaines superstructures (grosses centrales nucléaires notamment).
L’altitude joue également un rôle majeur sur la propagation de la pollution lumineuse : plus l’observateur est situé en hauteur, moins la propagation de la diffusion est importante. Ainsi, une ville située en contre bas d’ un point d’ observation établie 1000m plus hauts affecterait beaucoup moins la qualité de l’air pour l’observateur que si ce dernier était en plaine (au même niveau que la source polluante). Les effets de l’altitude sont semi-logarithmiques : à ce titre, les milles premiers mètres sont un facteur déterminant sur la qualité de l’air
Precautions of interpretation
This map is good only for a zenithal cone of 50° (from the vertical of a precise location) and don’t show the light pollution toward the horizon. To consider the value indicate on the map, it’s understood that the observer may have not to be expose himself to a direct light source and he have to be sheltered from a direct light source. The precision of the data are not guarantee : this is indicated values and obtain with arithmetic and non-based from reality. Locals phenomenas as lighting of monuments or public buildings, or at the contrary the extinction of the light from a certain time can elude the data.
This map show the light pollution at the time of 23:00, during winter, with a midle quantity of humidity around 85 percent. The highway, due to the cars light are systematicaly counted as a source of light pollution. Moreover, the glowing due the cars crossing can reduce to nothing around 20 minutes the nocturn vision of the observer and the quality of the local seeing. Aquatic places don’t have to be take in consideration : the light propagation of the light glare was voluntary reduce in a clearness concern. This map show the urban places : artisanal places, industrial places, residential places and some big building (nuclear central i.e).
The elevation play a dominant role on the light propagation : more the observer is high, less the light diffusion is important. In this way, a city located below an observation point at 1000m higher will affect less the air quality for the observer contrary to if this last was been in plain (at the same level of the light source).
The efect of the elevation are semi-logarithmic : the first thousand of meters have an important role on the air quality.
Legal
1 This maps are and rest the exclusive property of Frederic Tapissier / AVEX or its beneficiary.
2 The author give the authorization to diffuse this map only in a private context.
3 The rights can’t to be transfer by the user to nobody and for any reason.
4 All print demand, diffusiob may have to be approove by Frederic Tapissier / AVEX.
5 No modification of the data, particulary the colors and the range of samples, the exploitation size of this map can not be operate without the autorization of Frederic Tapissier.
6 This PDF is protect by Copyrights and others electronics marks, and is protect against modifications and the exptortations of the containing data.
7 The author can not be consider as responsable of the use of this data in any way.
8 The author did not garantee the precsion of the data who are approximatives, the values are obtaining by arithmetic. This document can not be consider as an official basis for any works, and decline any responsability past, present and future of the using and the interpretation of this data.
Hello,
I see like a line going through Lithuania (top right). One side of line is much brighter, and other – much darker. While I do not believe such division is life-like, which half is more closer to truth? Also, what date data are used?
hi
this is a border artifact from my light pollution algorythm. the left part is close from truth
i use various data. DEM ( digital elavation model from STRM 41) and Corrine data land cover for example
Bonjour
Je suis alleman et ne parle pas francais bien. Excuse moi por continue à écrire en anglais 🙂
I’d like to know whether you sell your great pictures as posters or if you no someone who does. I’d
love to have that map of european light pollution on my wall.
Cheers
Michael
Hi Michael
I can do a great poster (1m by 0.7m)
send me your e-mail at ftapissier @ gmail.com